English
 Spanish
 French
 Chinese
 Russian
 Portuguese
Earthquakes, volcanoes, and the example of Kilauea
News
20 May 2020
Earthquakes, volcanoes, and the example of Kilauea
When the Earth shakes or its molten mantle surges to the surface, the risk to infrastructure, personal property and life can be catastrophic. Earthquakes and volcanic eruptions are two of the most common geophysical disasters to which the International Charter responds. Both of these events are "natural" disasters, meaning that they are a result of normal Earth processes – as when tectonic plates shift or are thrust upward or when solid rock is melted deep within the sub-surface and pressure builds to a point where it can only be relieved when openings in the Earth's surface occur. While there are sophisticated volcanic observatories that use various measurements to forewarn of potential volcanic activity and global seismic networks that monitor real-time seismic waveforms for identifying earthquakes, scientists aren't always able to predict the timing or location of such events.
The International Charter has a long history of providing satellite data and analysis for management of these disasters. The first Charter activations for earthquakes and volcanoes occurred nearly 20 years ago, in 2001. Since that time the Charter has responded to 69 earthquakes and 37 volcanic eruptions. Earthquakes account for 11 percent of all Charter activations, while volcanoes account for 6 percent. Additionally, earthquakes have a hand in other disaster events, most notably tsunamis and landslides, but also volcanoes.
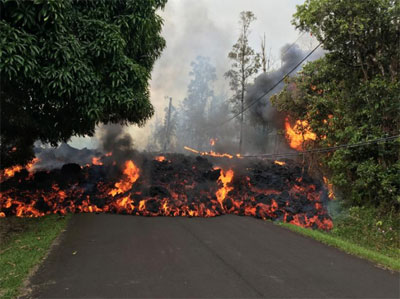
Kilauea Volcano, located on the US island of Hawaii, experienced thousands of small earthquakes at the same time that volcanic events were unfolding. It was May 3, 2018 when the State of Hawaii declared a disaster due to volcanic activity that had been ongoing since late April and had resulted in cracks and lava fissures that were impacting the Lower East Rift Zone in the vicinity of the Leilani Estates community of Hawaii. The following day, a magnitude-6.9 earthquake occurred and by the end of the day there were six lava fissures, each of which was several hundred meters long. Over the next 2-3 days, additional cracks and fissures opened in and near residential areas. Activity at the fissures was erratic, starting and stopping with lava fountains up to 100 meters high and lava flows that spread out to cover 36,000 square meters.
On Sunday May 6, there was a discussion within the US Geological Survey (USGS) Volcano Hazards Program about activating the International Charter for the activity at Kilauea. At this point, the desire was for deformation information (cracks, holes, flows, and collapses) and the need for Synthetic Aperture Radar (SAR) satellite data was of primary interest. SAR would be critical for use in the dense jungles of Hawaii, due to its ability to penetrate through the vegetation layer, but high-resolution optical data would also be needed for damage assessments.
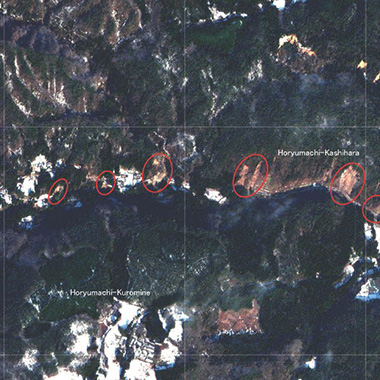
By the following morning, 26 homes and multiple structures had been destroyed by lava flows and more than 1,700 people had been evacuated. Julie Griswold, a volcanologist with the USGS contacted the US Authorized User and the Charter was activated on May 7. In addition to requesting the activation, she also offered her expertise to act as the project manager (PM) for the activation. An experienced PM, Julie was able to utilize several Charter assets for assessment of the disaster. SAR data from Sentinel-1B, RADARSAT-2, TerraSAR-X, KOMPSAT-5, and ALOS-2 were used to support mapping of activity inside of the Kilauea Volcano and Halema'uma'u Crater, damage assessments of property and infrastructure, and active fissures/lava flows (see image below).

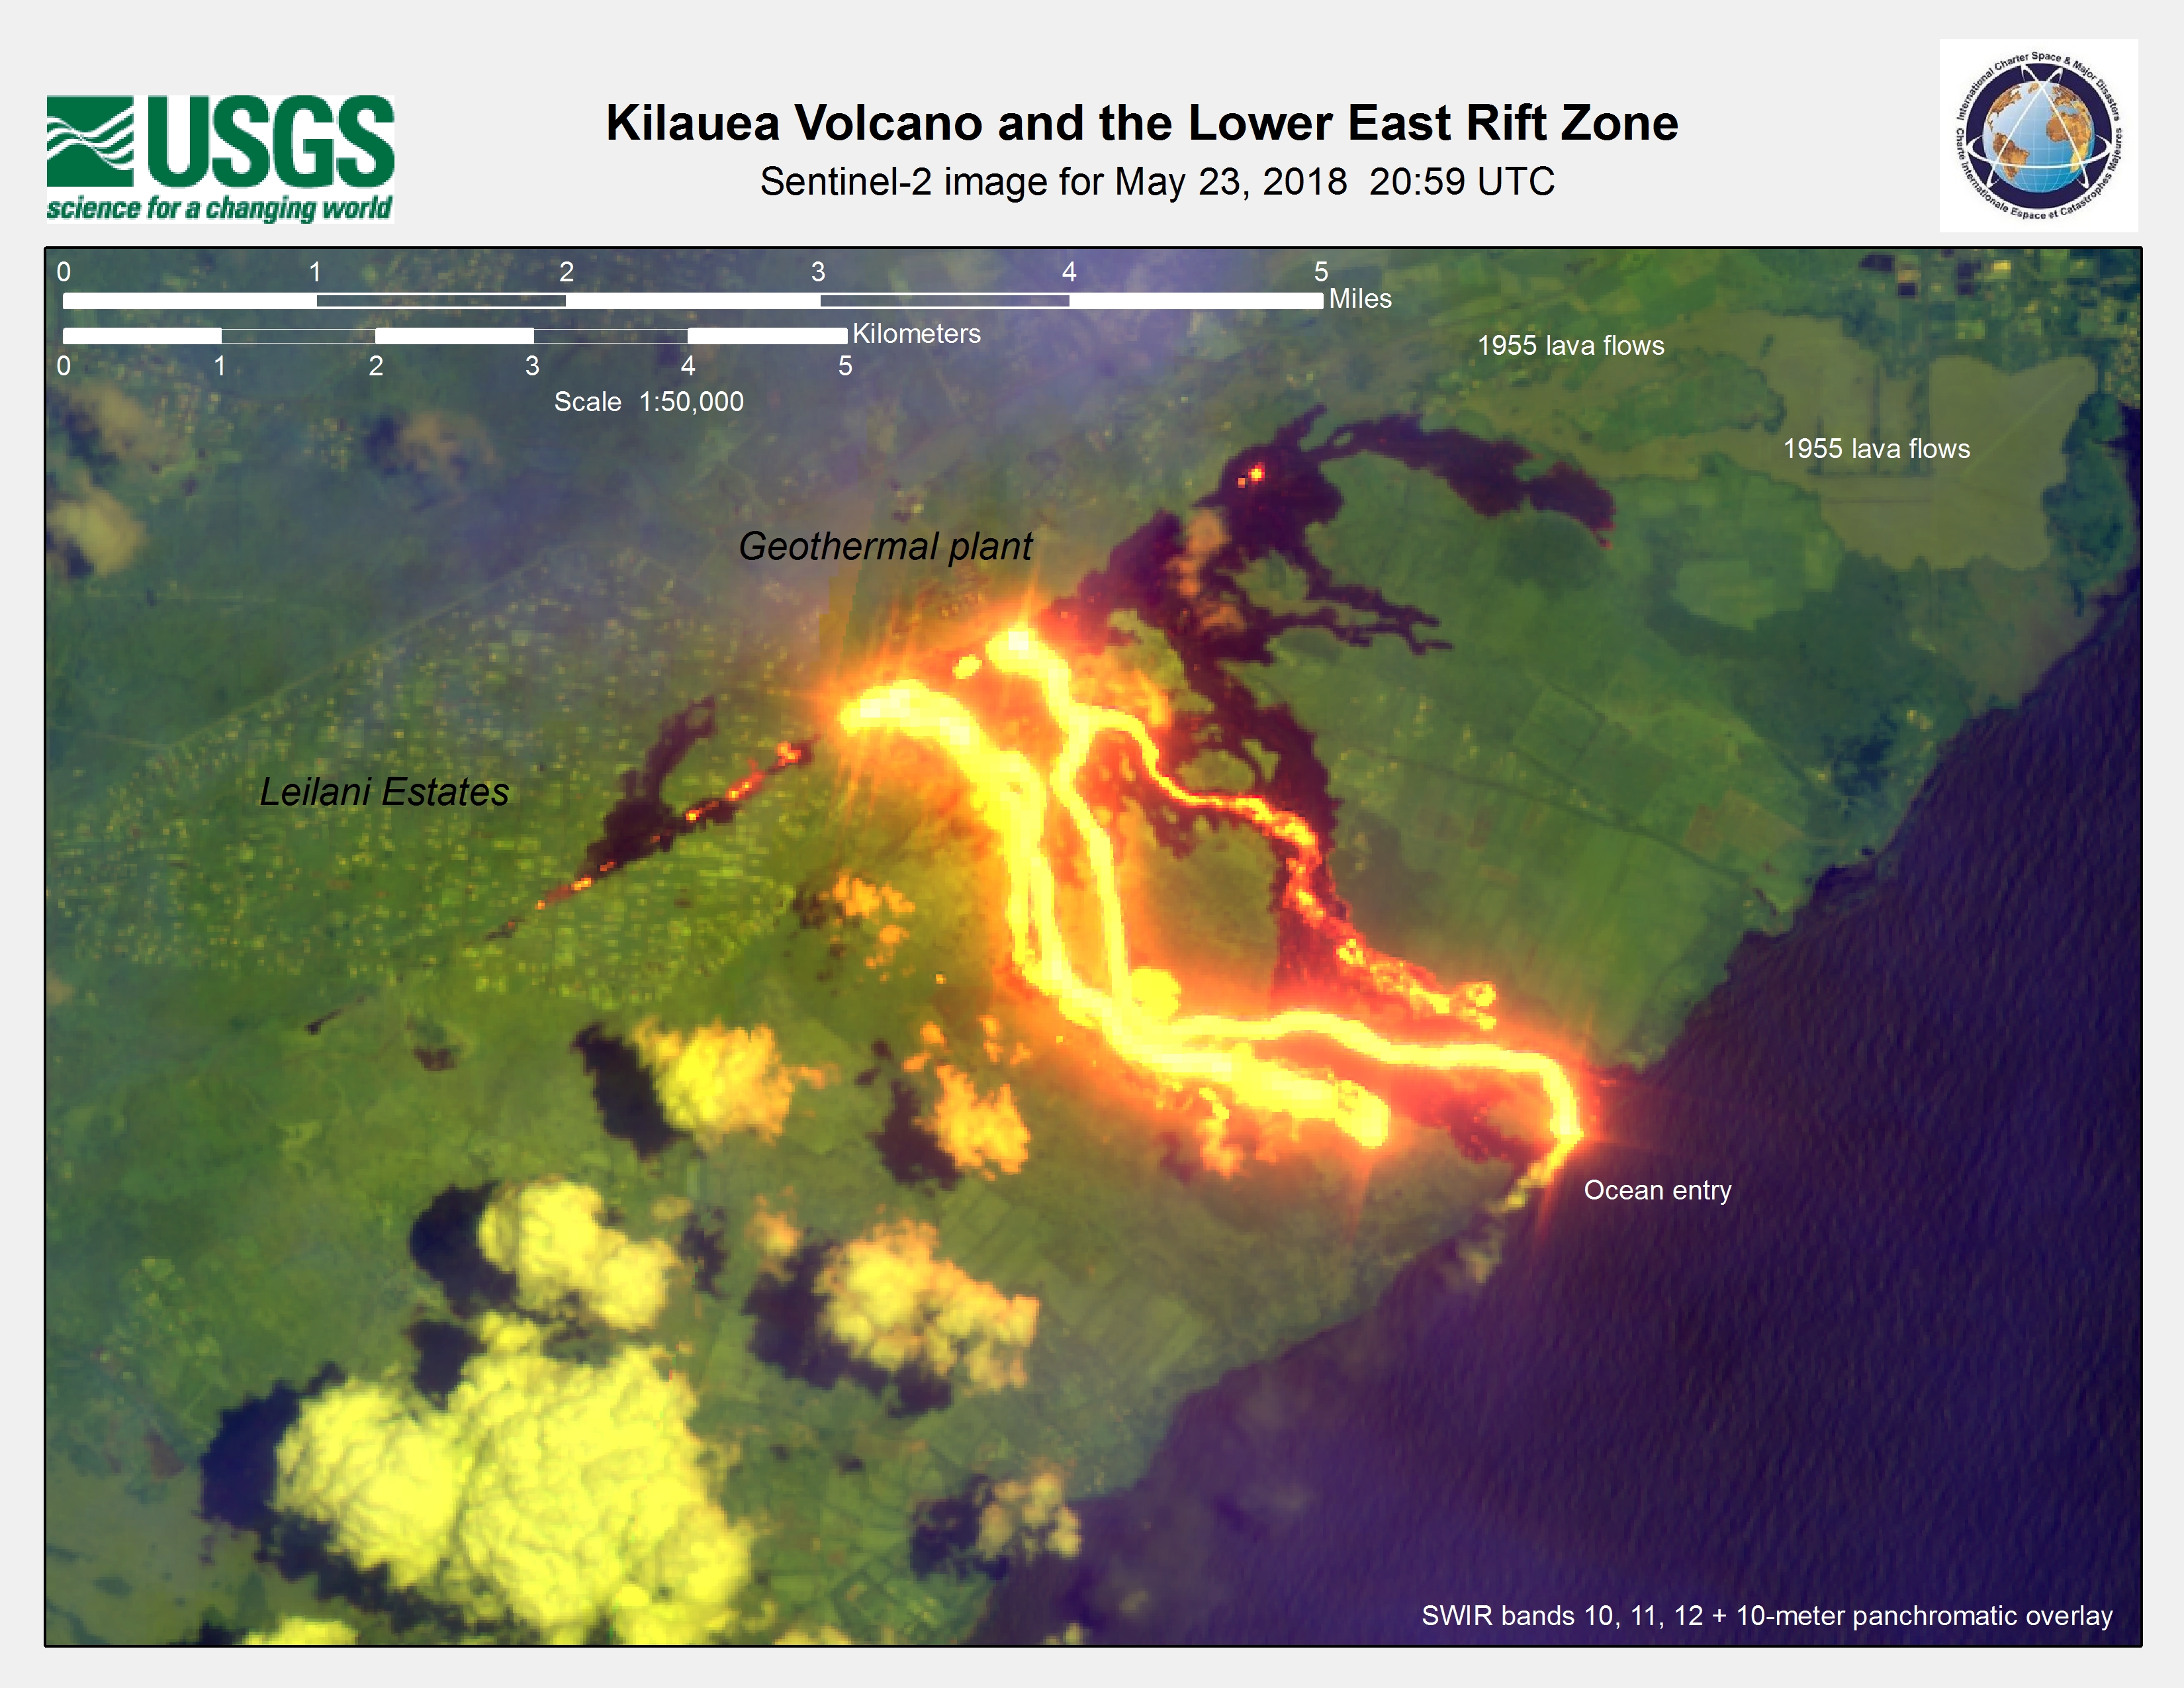
In addition to the SAR imagery, several optical platforms including WorldView-3, Sentinel-2, Landsat-8, UK-DMC-2, Gaofen-2, Pleiades, and LISS-III were primarily used for damage assessment mapping, but some of the sensors also captured spectacular lava flows like the one below from a Sentinel-2 acquisition on May 23, nearly 20 days after the event began.
These are but a few of the large number of value added map products that were developed for this event. In all, more than 60 different maps were generated to support work being done by emergency management agencies. One such agency, the National Civil Applications Center (NCAC), found the Charter data to be invaluable in monitoring the event. Gary Fisher, senior analyst at NCAC, said, "During the eruption we used multiple data sets to monitor and map this event on a daily schedule (sometimes twice daily). The quantity of remote sensing data that was being collected during this event enabled us to capture the advancement of the lava each day and accurately map where it was most active and spreading across the landscape."
The large volume of Charter data that was provided and the substantial number of derived products is a testament to the broad benefits of this international collaborative body.

Related News