English
 Spanish
 French
 Chinese
 Russian
 Portuguese
How the Charter monitors cyclones and ocean waves
News
21 July 2020
How the Charter monitors cyclones and ocean waves
Tropical cyclones are weather phenomena that form over the ocean through the release of energy generated by evaporation and saturation of water on the ocean's surface. This process results in heavy rain and strong winds and when these storms approach land they can cause damage and flooding to inhabited areas. Cyclones are also frequent natural disasters across the world. Depending on their origin region, these are called Cyclones (in the Indian and south Pacific Oceans), Hurricanes (in the Atlantic and northeast Pacific Oceans) and Typhoons (in the northwest Pacific Ocean). About 20% of Charter activations are a result of tropical cyclones.
Ocean waves are most typically tsunamis, but storms with strong winds can also cause hazardous coastal waves or storm surges. The majority of tsunamis occur in the Pacific Ocean's "Ring of Fire", a wide area stretching roughly from the western coast of South, Central and North America and then across to the eastern coast of Russia, China, and the entirety of Japan, the Philippines and many islands in the south Pacific Ocean. Tectonic plates meet in this ring, and as such it as a geologically active region.
The first Charter activation for Cyclones was in October 2002 for Hurricane Isidore in Mexico and the first tsunami disaster for the Charter was for the 2004 Indian Ocean tsunami, a major disaster that affected 14 nations and triggered three separate activations. Examples of major cyclones the Charter has been activated for include Hurricane Katrina (USA) - 2005, Cyclone Nargis (Myanmar) - 2008; Typhoon Haiyan (Philippines) - 2013, Cyclone Phailin (India) – 2013, Cyclone Hudhud (India) – 2014 and most recently Cyclone Amphan (India, Bangladesh) – 2020. Similarly, some of the major tsunamis include the Japan tsunami – 2011 and a recent tsunami in Indonesia – 2018.
Due to quick and synoptic views, data from both SAR and optical satellites is quite useful in providing support during the response phase of a disaster. Given that optical imagery cannot penetrate clouds, it is often not possible to acquire clear imagery while a storm is ongoing and during this time radar data provides invaluable insight into what is happening on the ground. The Charter has then demonstrated the value of optical data in the aftermath of storms during several such disasters, in identifying the affected areas using moderate resolution satellite data and damage assessment using very high resolution satellite data.
Typhoon Haiyan, a category-5 cyclone, devastated the Philippines during November 2013. Typhoon Haiyan set a world record for highest wind speeds measured at landfall of 315 km/h (or 195 mi/h). It was the deadliest typhoon ever to hit the Philippines, leading to about 6,300 deaths. With very high resolution satellite data, the damage to infrastructure and houses could also be identified very quickly, helping the authorities to respond efficiently.
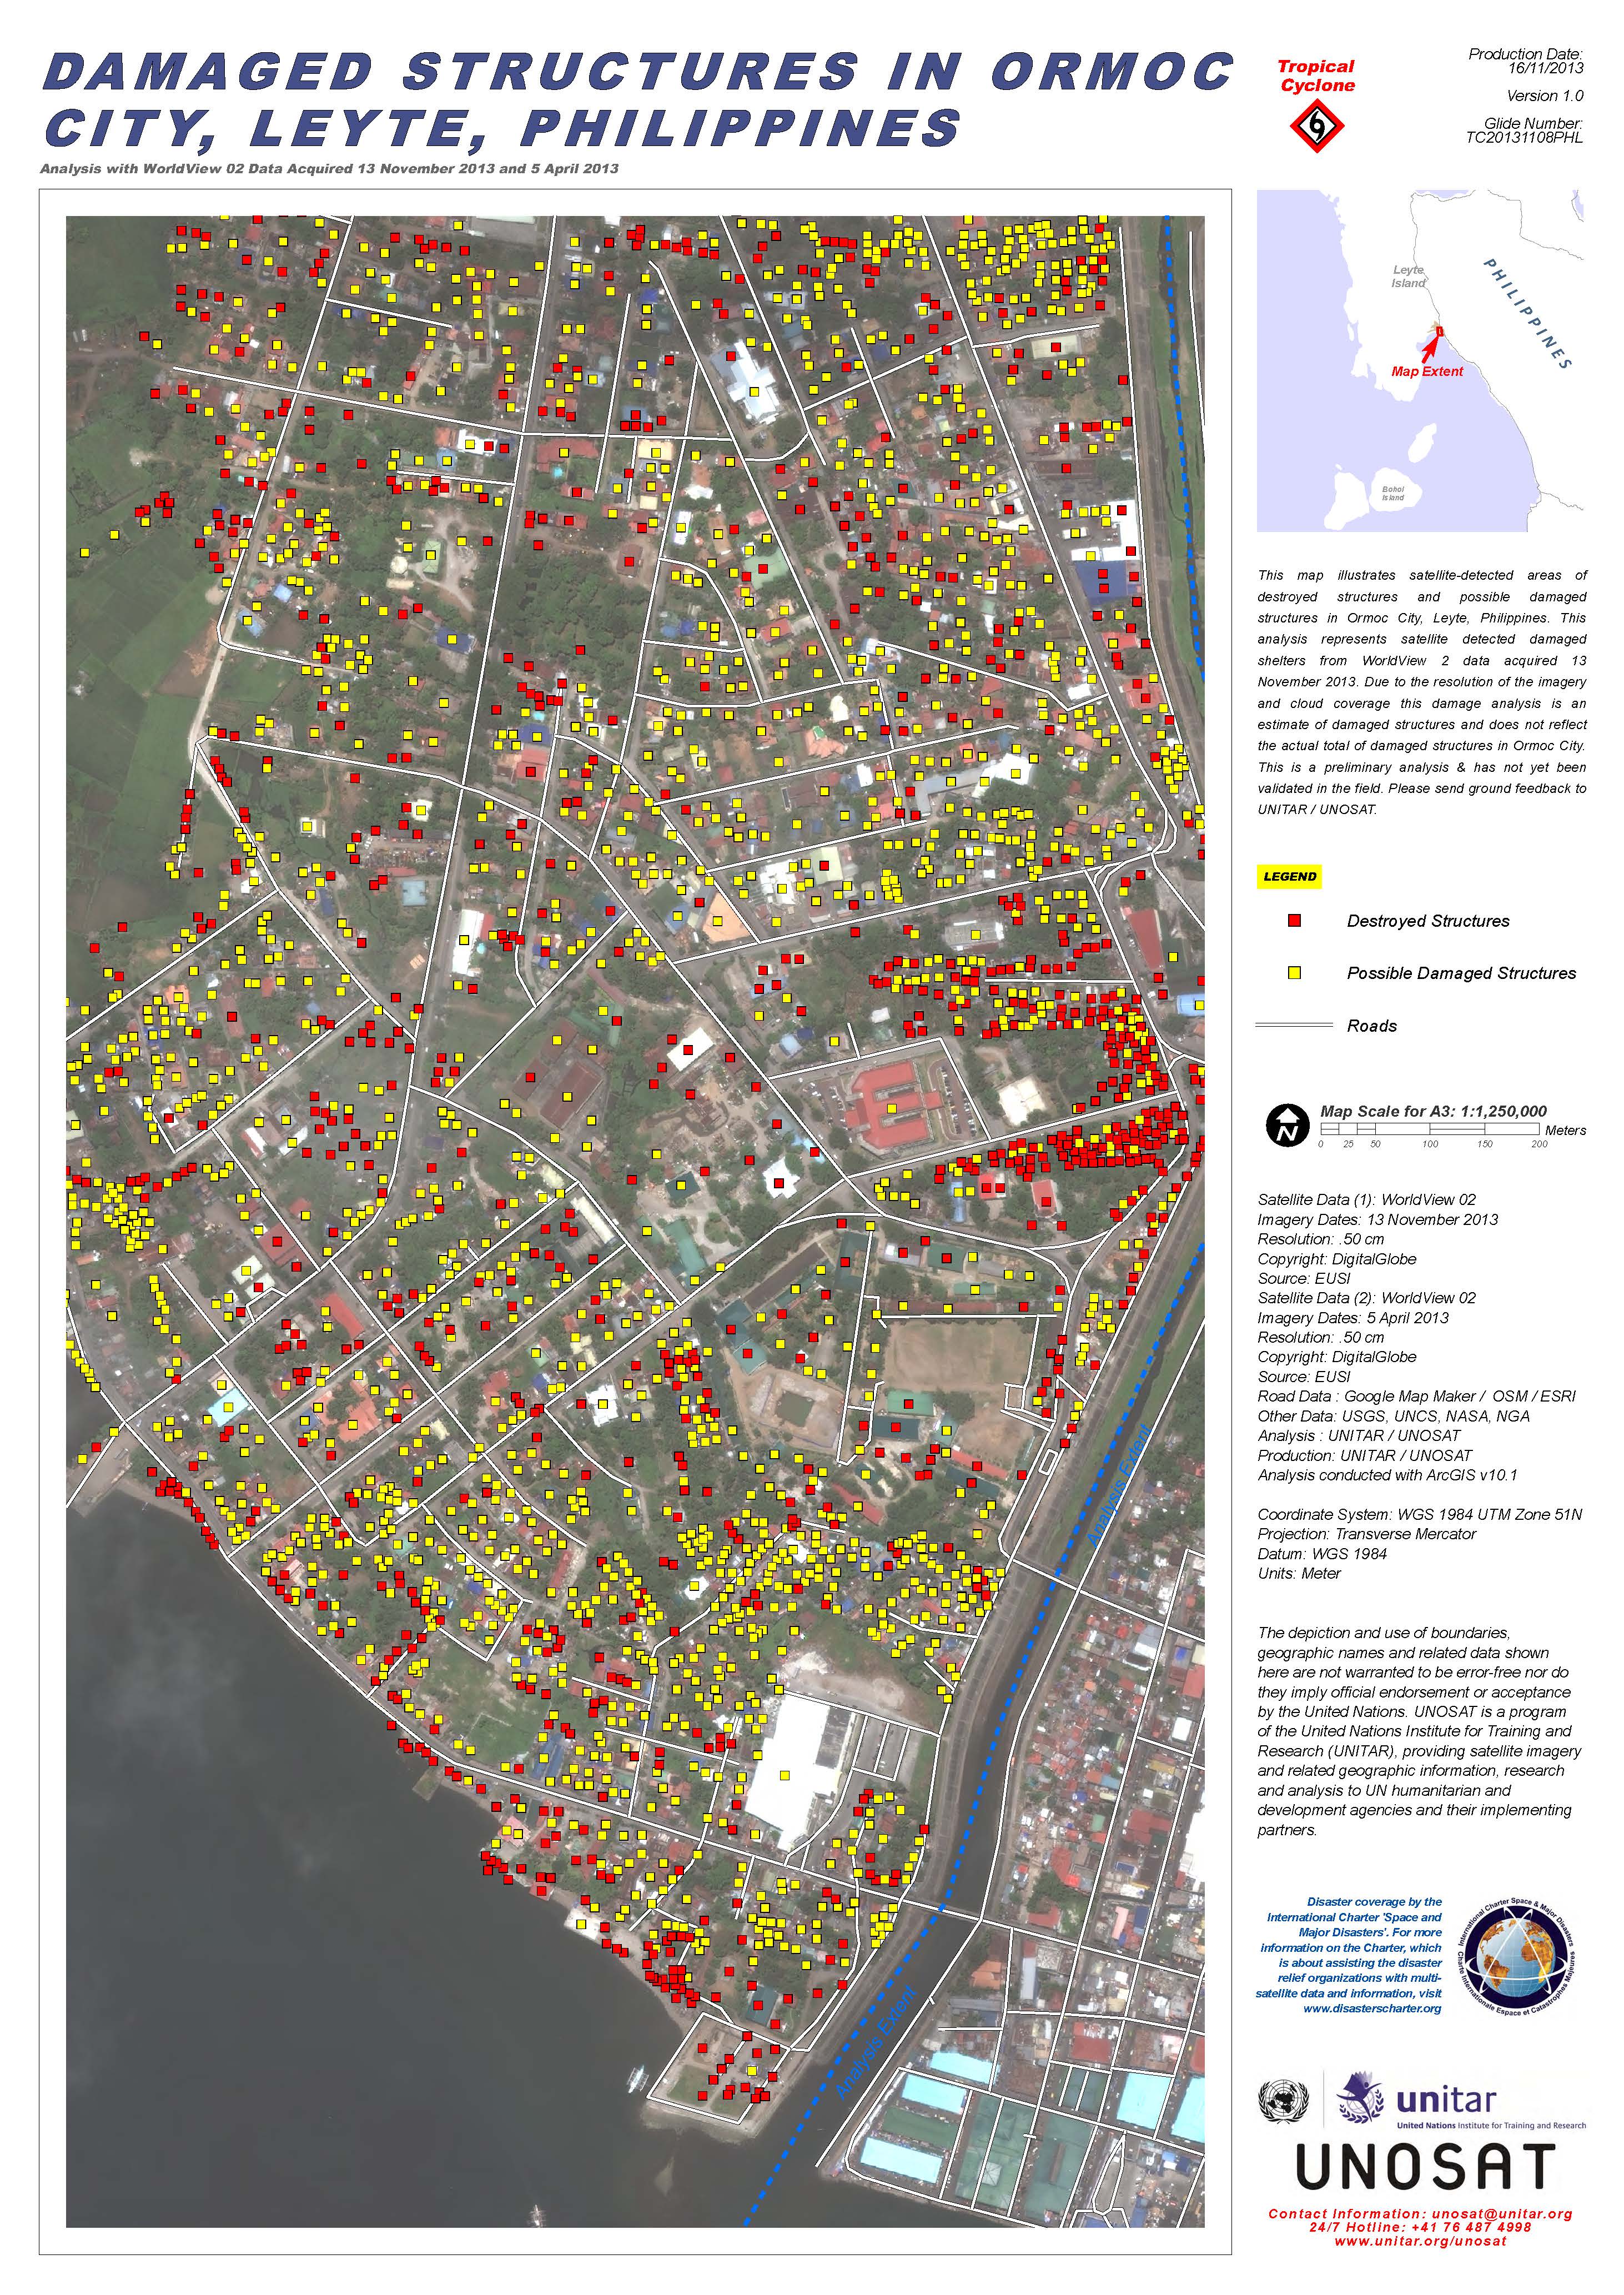
Damaged structures in Ormoc, Philippines during November 2013. Copyright: Map produced by UNITAR/UNOSAT
Similarly, mobile app based data collection was integrated along with high resolution satellite data for quick damage assessments after Cyclone Hudhud in India during October 2014.
During the recent Cyclone Amphan, which devastated India and Bangladesh during May, 2020, satellite data helped disaster managers to respond quickly. The following high resolution satellite data shows damage to a bridge in Odisha.

Damaged bridge due to Cyclone Amphan in Odisha, India. Copyright: Map produced by NRSC
In the case of tsunamis, as the response time is longer, the damages are generally more. The Great Indian Ocean tsunami devastated several countries. The tsunami killed an estimated 227,898 people in 14 countries, making it one of the deadliest natural disasters in recorded history. The following Charter product shows the damage extent due to the tsunami over Indian islands during December 2004.
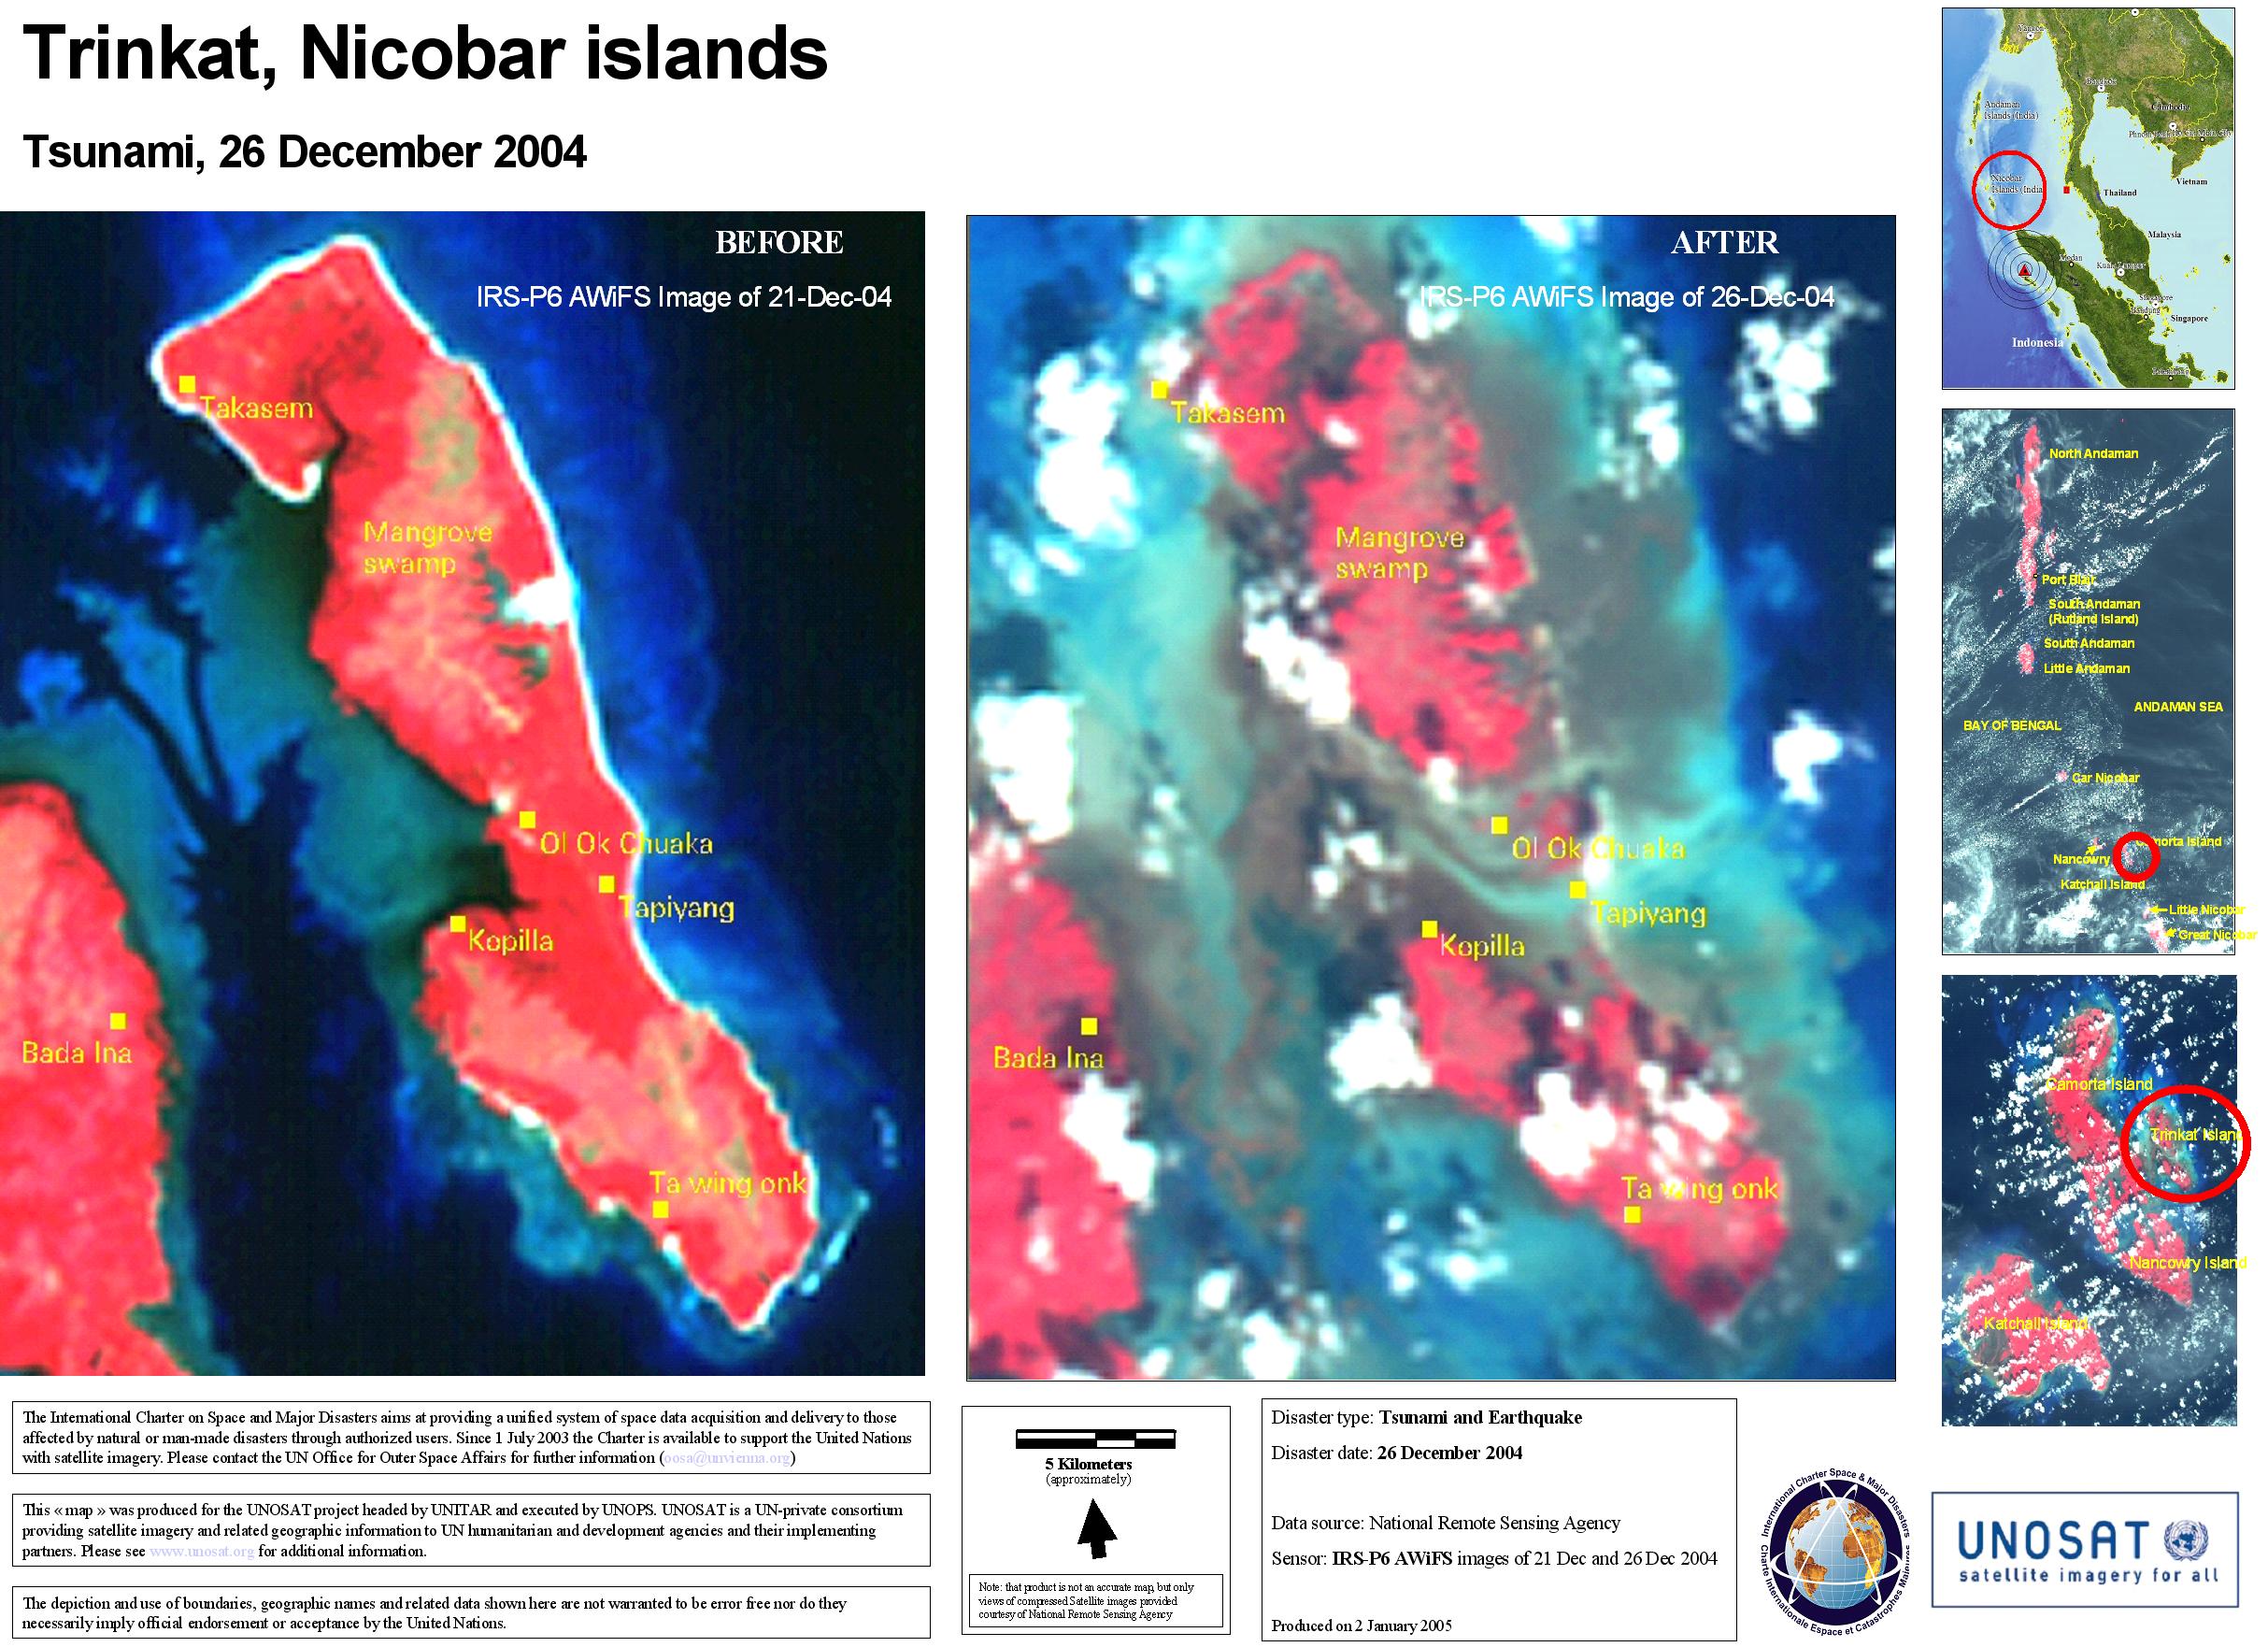
Tsunami affected areas in Andaman and Nicobar Islands, India during December 2004. Copyright: Map produced by UNITAR/UNOSAT
The satellite based products were extensively used in Indonesia, Thailand, Sri Lanka, India and other countries for relief activities. For the Charter activation, the UN's photo library hosted some 650 maps produced by UNOSAT, Charter member agency DLR, the French rapid mapping organisation SERTIT, and other partners of the Charter. The maps were accessed by 41 relief organizations. UNOSAT's website recorded 200,000 map downloads during the tsunami crisis.
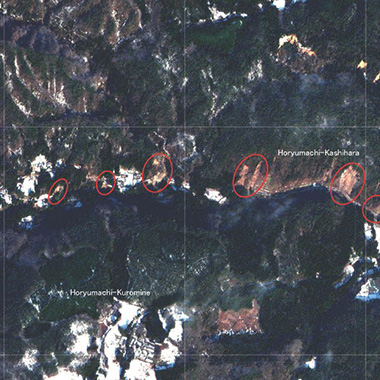
Similarly, during the Japan tsunami in March 2011, satellite inputs helped in identifying the damages to various structures including the Fukushima nuclear power plant. With about 15,000 casualties, and widespread damage to infrastructure, this disaster had a major impact on lives and the economy.
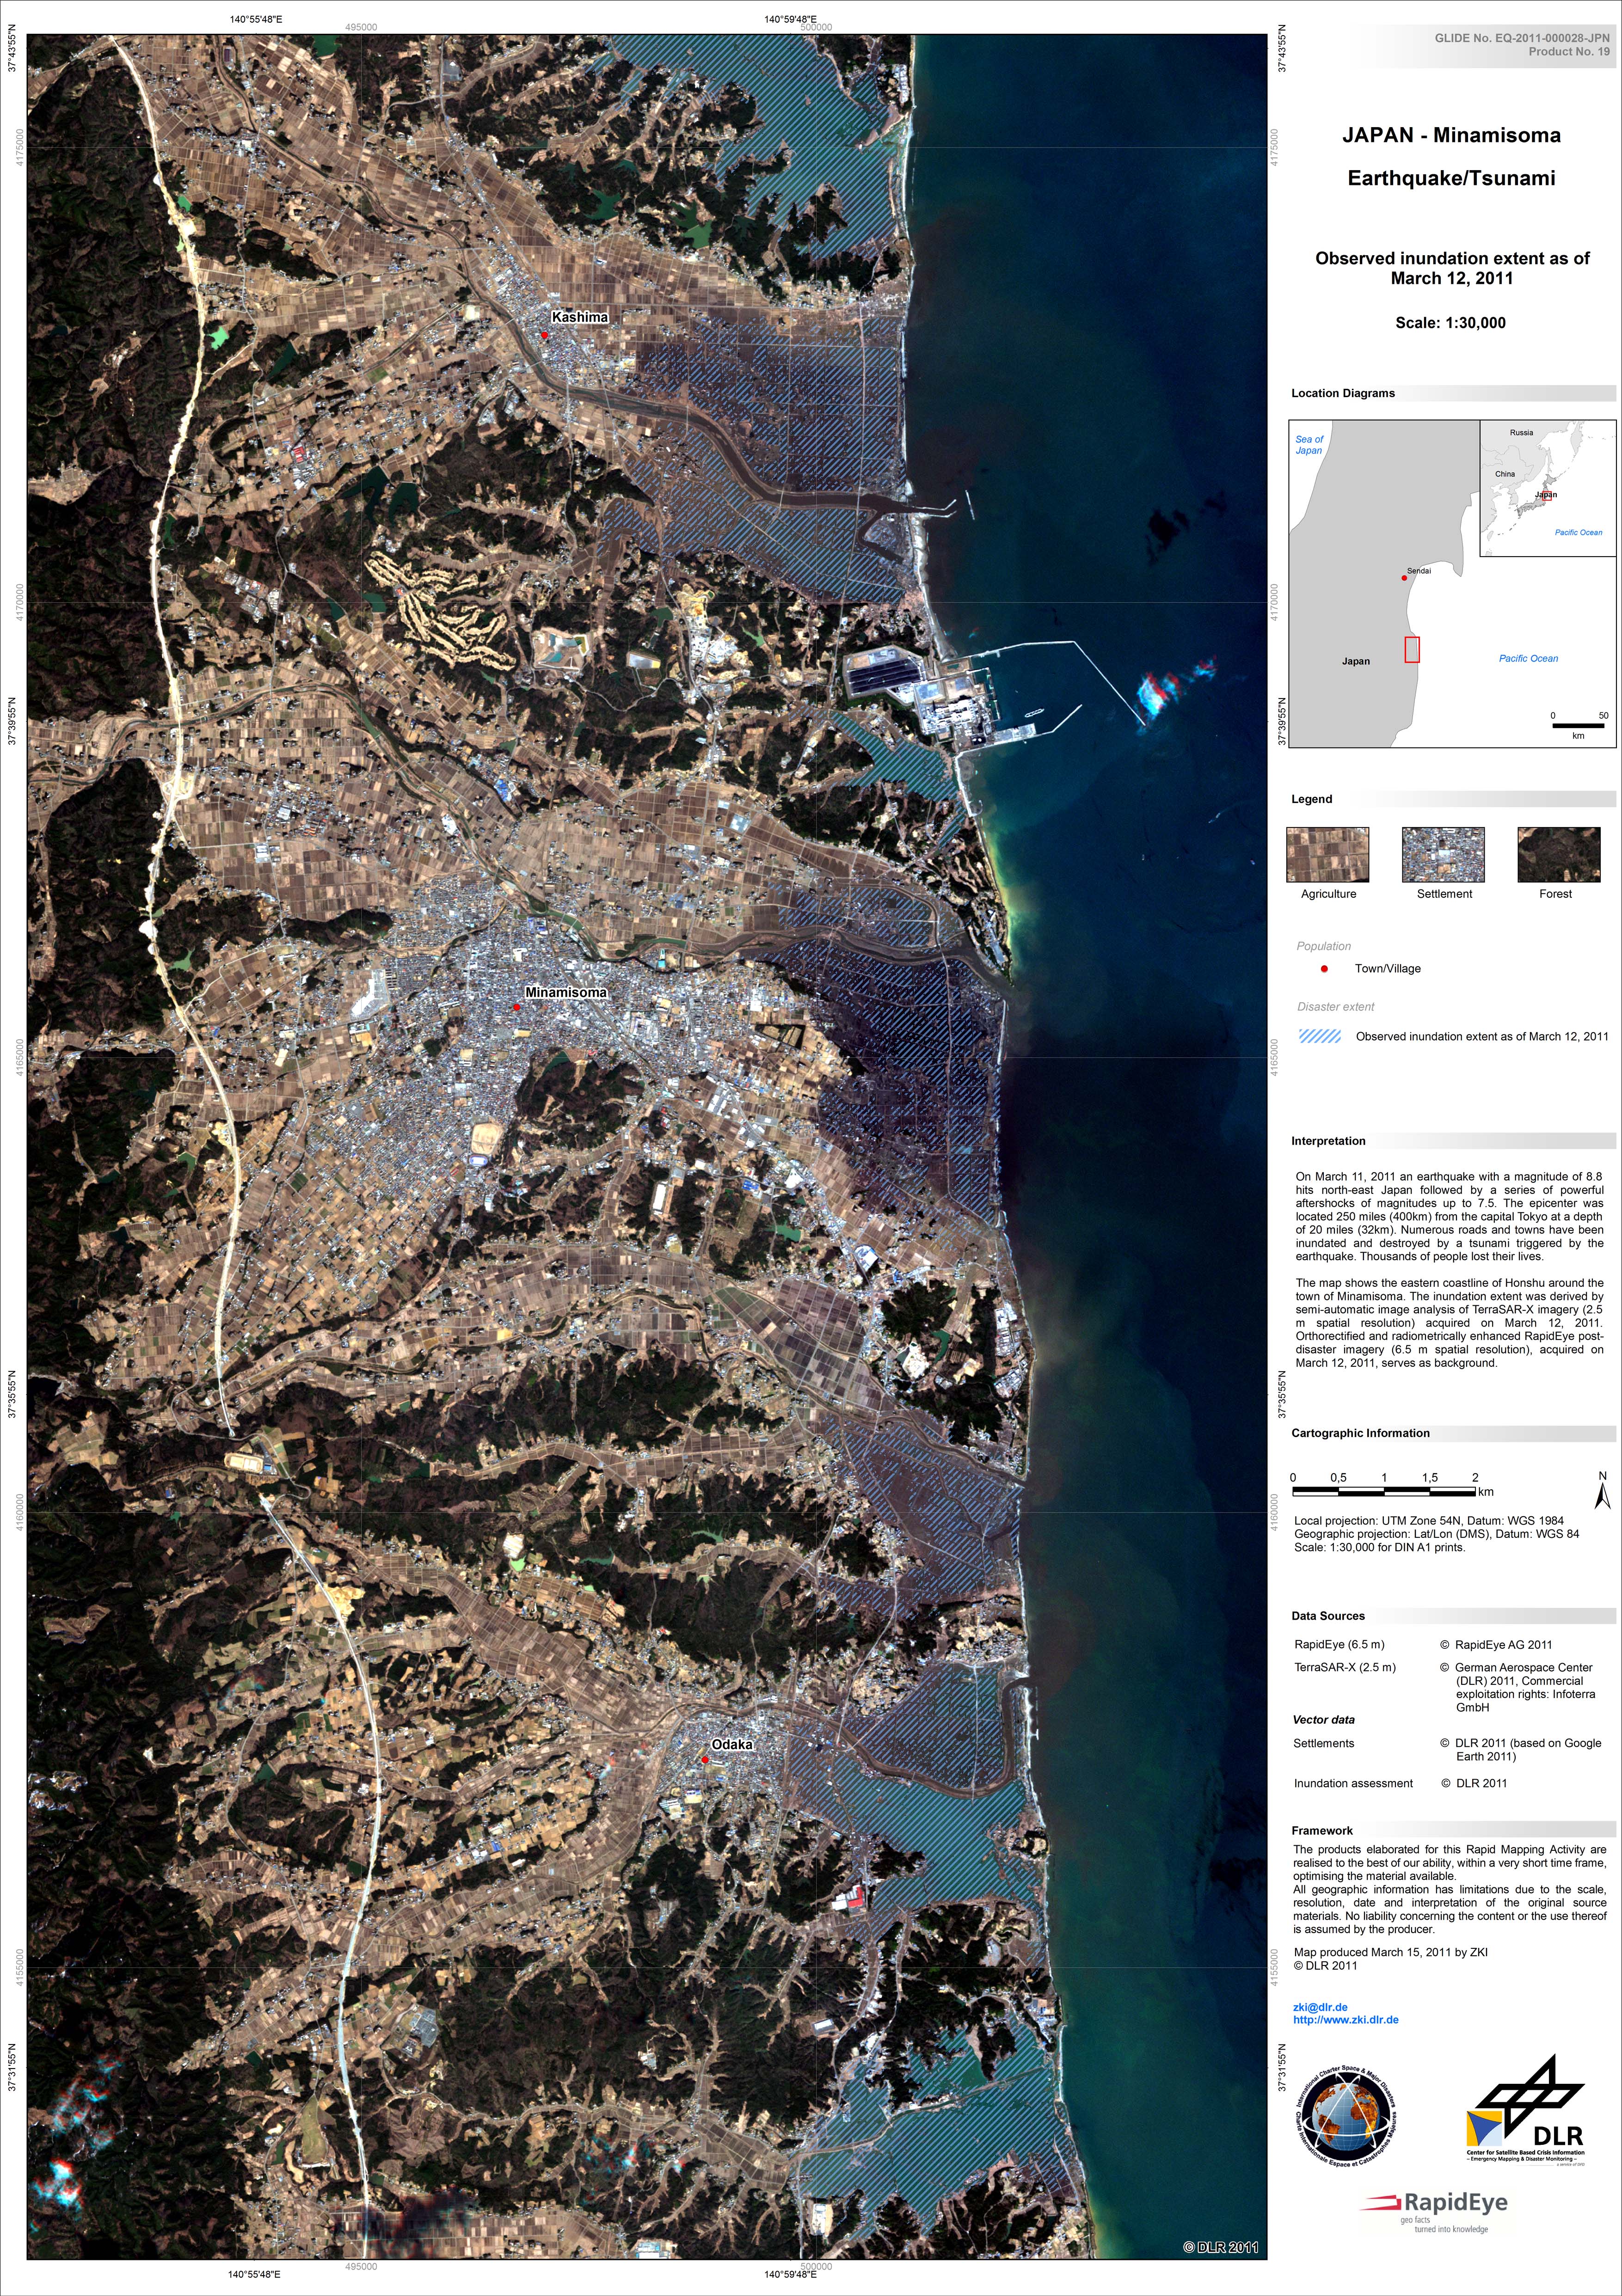
Tsunami affected areas in Japan during March 2011. Copyright: Map produced by DLR/ZKI
With increased incidence and magnitude over the years, cyclones and Ocean Waves are devastating the development efforts of various countries across the globe. Through the International Charter framework, with a growing membership of space agencies and space system operators, it is of great value for disaster managers to use data from the Charter to quickly respond to these events and to save lives and property.

Related News